NM-208
Understanding the Patient Experience: Modes of Transportation and Perceived Transportation Barriers for Patients Scheduled for Elective Ambulatory Surgery at a Children’s Hospital
Tan J, Kodavatiganti M, Galvez J, Simpao A, Dubow S
The Children's Hospital of Philadelphia, Philadelphia, PA, United states
Introduction
Access to pediatric health care can be complex and limited by socioeconomic, demographic, medical and location factors. Barriers to care can cause late or missed appointments and can impact patient health and decrease the efficiency of a health system.1 Studies show transportation issues can lead to late or missed appointments.2 However, this research was limited to primary care and minority populations. They did not describe the transportation modalities used to access pediatric surgical care or perceived transportation barriers.
Our objective was to determine the modes of transportation and perceived transportation barriers for patients scheduled for elective surgery at a major academic children’s hospital.
Methods
A survey tool was created and administered to parents/legal caretakers of children presenting for elective ambulatory surgery at The Children’s Hospital of Philadelphia.The survey had both qualitative and quantitative assessments of transportation modes and perceived transportation barriers surrounding their child’s surgical care. Nurse practitioners administered the survey as part of the pre-operative evaluation in May 2016. Data was collected and statistical analysis was conducted using JMP (v. 12.1.0, SAS Institute Inc., Cary, NC).
Results
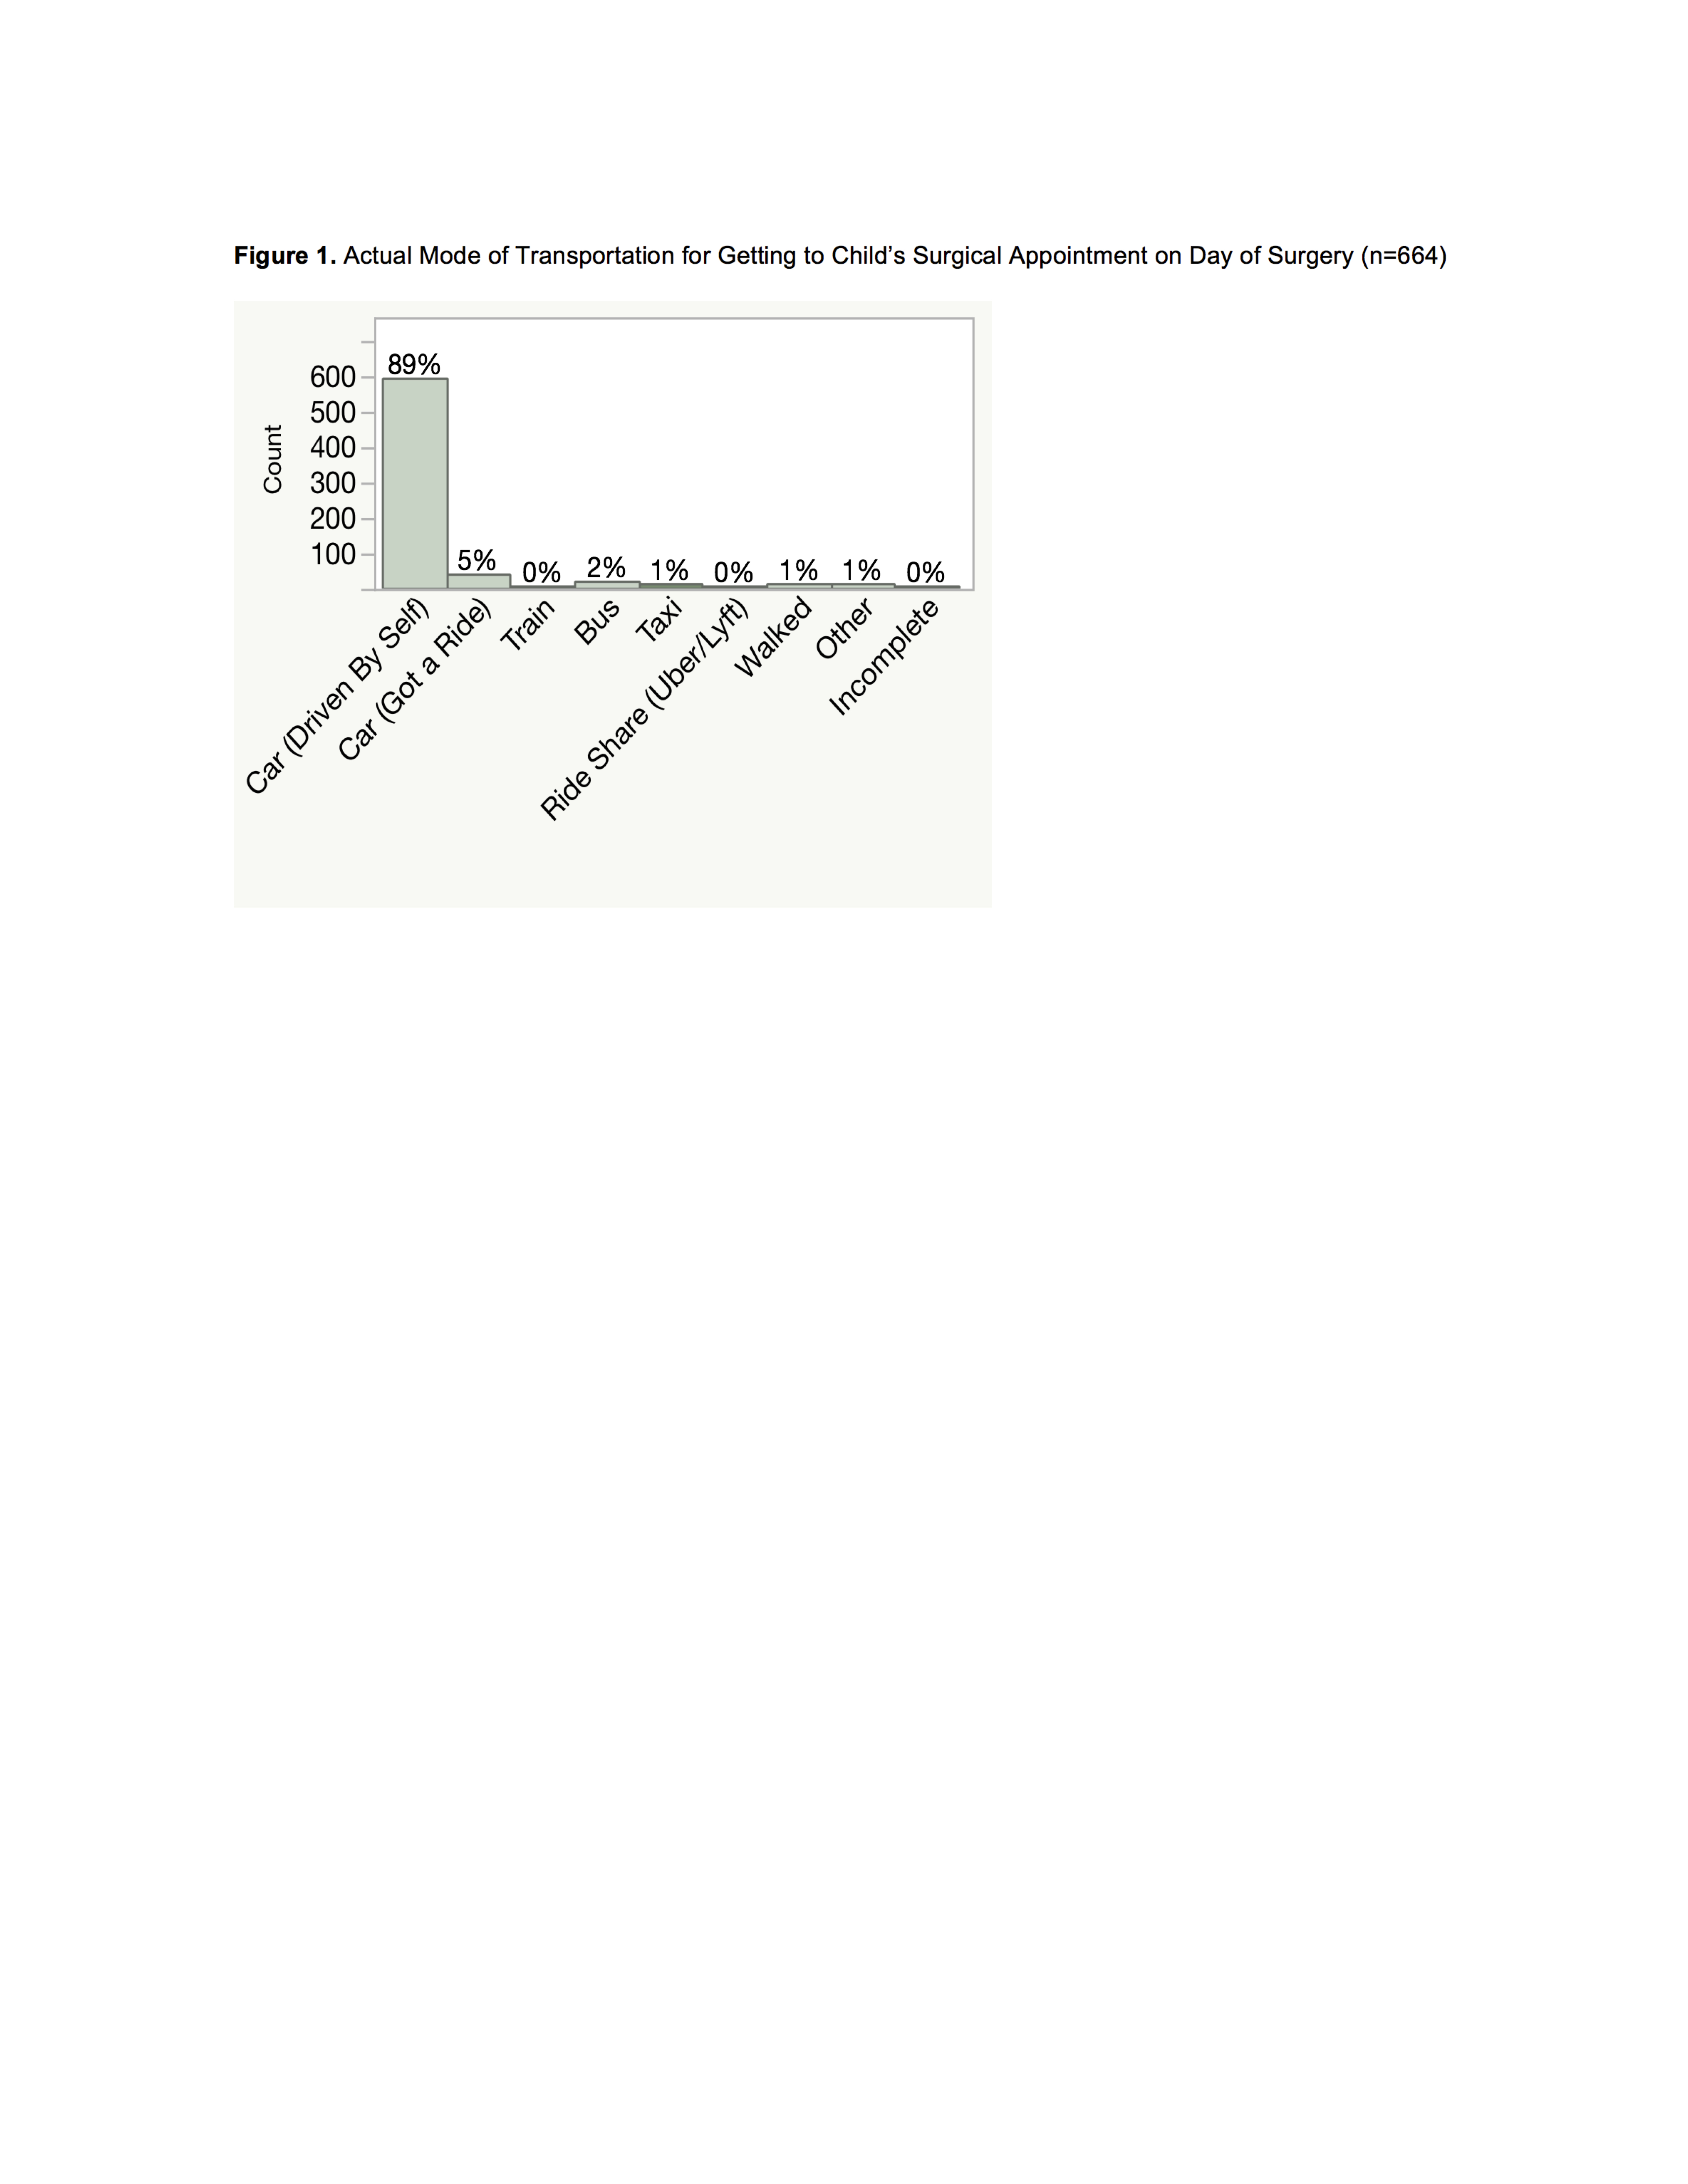
A total of 664 unique patient surveys were completed. The mean age was 7.6 years (SD 7.7) with 59.5% male and 40.5% female. Figure 1 demonstrates the actual mode of transportation taken by the family/caretaker to arrive at the hospital on the day of surgery. The most common was for family/caretakers to drive themselves (89%), followed by obtaining a car ride from someone else (5%). The number of patients who walked, took a bus, train, or ride share service, such as Uber or Lyft was limited. Overall, 12% (77/664) of patients self-reported being late as compared to their expected time of arrival and cited traffic as the main reason for delay. Reasons ranged from unexpected traffic, poor directions and weather. Planned transportation modes for going home following elective pediatric surgery were different for 20% (136/664) of patients as compared to their actual arrival mode before surgery.
Discussion
Transportation modes and perceived barriers to transportation have been studied in the pediatric primary care setting but not in a pediatric surgical population. Our study is the first to describe transportation modes and perceived barriers in children scheduled for elective surgery. Future studies should account for socioeconomic, demographic and location factors and address possible disparities in transportation challenges to access pediatric surgical procedures.
1 Grant R et al. The Health Transportation Shortage Index: the development and validation of a new tool to identify underserved communities. Children’s Health Fund. 2012
2 Grant R et al. Transportation Barriers to Child Health Care Access Remain After Health Reform. JAMA Ped. 2014; 168
-
 NM-208 Image 1
Top